27 August, 2003: Maldon Calling
It's nice to see the Shadow Cabinet doing their bit to alienate another segment of the population -- about five million of them, this time. Here we have John Whittingdale, MP for Maldon and East Chelmsford and Conservative Shadow Secretary for Culture, Media and Sport, telling us that the BBC web site is a Bad Thing, on the basis that
the same services are provided by commercial operators
-- services like background information on BBC programmes, reporting done by BBC journalists, copies of BBC programmes already paid for by the licence fee, free educational material for schools, historical news material and so forth.
Naturally, Whittingdale has a good reason for all this:
As a free-market Conservative, I will only support a nationalised industry if I'm persuaded that that is the only way to do it.
-- isn't it odd how the Right has become dogmatic just when the Left has become pragmatic? A cynic might suggest another motive; the Register of Members' Interests tells us that last year Whittingdale received, (emphasis mine)
Gifts, benefits and hospitality (UK)
6 July 2002, my god-daughter and I attended the Wimbledon Tennis Tournament as guests of Provident Financial. (Registered 10 July 2002)
7 December 2002, I attended a day's shooting at Glimpton Park as a guest of Associated Newspapers Ltd. (Registered 19 December 2002)
20 February 2003, my wife and I attended the Brit Awards at Earls Court as guests of the British Phonographic Industry. (Registered 12 March 2003)
... that said, Associated Newspapers have, by their standards, a reasonably balanced piece on Whittingdale's idea and I imagine that a single weekend of murdering cute fluffy animals isn't enough enough to change the direction of Tory policy. I suppose being Shadow Secretary for Culture, Media and Sport must be fairly dull, since Whittingdale's previous media triumphs include venturing that he's opposed to sex -- on TV, anyway.
Ah well. You won't win my vote by promising to abolish services I use every day.
Meanwhile, we have the BBC proposing to put their programme archive on the web, (a wonderful idea, which doubtless they'll stuff up by using a dumb proprietary format for the programmes, but you can't have everthing) and, simultaneously, the DCMS reviewing the operations of the BBC web site.
The review is, again, concerned with the `market impact' of the BBC's services. It's reasonable to expect that the BBC's offerings will distort the `market' in online news -- just like News Corporation's do in the newspaper market. Is this a problem?
Obviously the BBC's effect on the marketplace is only important if it is preventing the appearance of other services which provide better value for the consumer. Is this likely to be true?
We can look at other media markets, such as the United States, where there's no BBC market distortion (just the regular kind provided by fair and balanced sources like Clear Channel and News Corporation) and... we find that people in the US are increasingly reading the BBC and other European news sites rather than local media offerings.
While I appreciate the the Government is dead keen to allow News Corporation and Disney to control all media outlets in the UK that's hardly likely to improve what's on offer.
In any case, all we can do is wait for the results of the review. I note that it is possible to submit comments on the review procedure. I recommend everybody does; I have no doubt that consultation responses will be treated in the same spirit of fairness and impartiality as in previous consultations.
There is another issue we should address when thinking about the BBC: the television licence fee. Being a flat fee, this is regressive taxation and therefore Bad and Wrong. But typically, those campaigning against the fee -- such as the Sunday Times -- do so not because of a horror of regressive taxation but because they think that the fee is a good point of weakness which can be used to attack the BBC as a whole. I don't see people attacking the principle of -- say -- income tax simply because it's used to fund a particular service they don't like.
The licence fee yields about £3 billion per year, corresponding to about £100 from about 30 million television-owning households. This is a bit under 3% of annual income-tax revenue (about 0.7p on the basic rate) or approximately the cost of Britain's military involvement in Iraq.
Would we be better funding the BBC from general taxation? It's not clear. Presently you can choose whether or not to contribute to the BBC; if it were funded from general taxation, that would no longer be the case. But since it turns out that most households do choose to watch TV, it would certainly be better to have a progressive television licence fee.
(Another alternative would be to tax commercial broadcasters to pay for the BBC. However, despite being handed monopoly rights to vast swathes of the electromagnetic spectrum, benefitting from heavily-subsidised satellite launches, allowed to carry adverts and broadcast any old crap, to charge people money for watching football games that used to be available free on the BBC, and to plug their services endlessly in the newspapers, broadcasters like Sky struggle to make significant profits -- only £129 million last year.)
Update
Before writing the above, I emailed John Whittingdale about his proposals. I didn't, in all honesty, expect a reply, but to my surprise I've now received one. To quote the most important parts of his email,
Let me be clear. It is not the policy of the Conservative Party to close down the BBC Web-site. However, I do believe that BBC interactive should be examined, along with every other aspect of the BBC's activities, as a part of the process of Charter review.
-- which is good news, though he continues, (emphasis mine)
With regard to the BBC's On-line activities, it is clearly sensible that the BBC make available its programmes through the web to allow greater access to them. BBC News also has a deservedly high reputation and I recognise that many people rely upon it. However, it is only sensible to ask whether it is right to have a state-owned and funded web-site, whether it is a proper use of public money and whether it is preventing other commercial organisations from entering the market. I welcome the fact that, almost simultaneous to my own comments, the Government announced that it had asked Philip Graf, former Chief Executive of Trinity Mirror, to conduct a review of BBCi considering exactly the same questions.
-- which is the same, troubling, dogmatism reported in the Guardian piece I quote above. Again, no argument for whether increased competition will actually improve the media available to the British public (and, incidentally, others around the world).
Just to repeat that, the idea that increasing competition in the markets in which the BBC competes will improve services available to the public is only a hypothesis. While creating markets in (e.g.) domestic electricity supply has lowered prices -- and reliability -- there's no reason a priori to assume that limiting the BBC's activities so as to encourage commercial operators to set up their own (say) news web sites will improve the standard of service available to the public. It's worth pointing out that, for instance, all of the News Corporation newspapers' web sites are crap -- The Times, for instance, charges for access to its archives and isn't properly searchable. (Not, I think, coincidentally, the most useful of the newspaper sites is the Guardian's -- run by the Scott Trust, not a fatuous corporate behemoth --or, rather, `the only vertically integrated media company on a global scale'.)
24 August, 2003: The Number You Have Dialled Has Not Been Rebranded
The directory enquiries service provided by your telephone company has now, as everyone has heard, been replaced by a set of commercial services with six-digit numbers starting 118. The notion is that the commercial services can compete on price and customers will choose the best-value ones, resulting in a dose of healthy capitalist goodness all round. As many in the media have pointed out, this is rather silly, because most consumers won't put in the effort to research which service to use and will probably end up getting ripped off, at least until the new services are well established in the public's mind.
Ofcom have missed an obvious way to retain the user simplicity of the old system while getting the benefits of competition. All they need to do is to solicit price information from all the 118... services, and then have calls to 192 automatically redirect to the cheapest of them, prefixed with a message saying
Your call is being redirected to 118 xyz, provided by name of directories company, which is likely to be the cheapest provider for your call. Hang up now and redial if you wish to use another provider.
The vast majority of consumers would carry on using 192, and automatically get the cheapest service. If their needs were more complex (e.g. they need to resolve several numbers in a row), they would still be able to pick from a list of more specialist providers. As an added bonus there would be no need to plaster the Underground with posters of moustachioed refugees from the 1970s running around with numbers on their chests.
Ofcom come so close with,
Callers now hear a recorded message with a freephone number that selects at random the number of one of the more than 20 replacement services, which all begin with 118.
-- if only `selects at random' were replaced with `selects the cheapest'. (Note that the BBC article above heavily promotes two particular services, which seems a bit odd.)
Of course, you may as well use BT's free on-line directories service; rather feebly, they try to permit only ten searches per day per web browser (or, as they think, `per person'), but this is `enforced' with cookies, so if you just delete the BT cookie and go back to directory enquiries home page, you can use it as often as you want. Idiots.
Update
Anthony Wells has some complaints about the above (as well as arguing that suggesting a solution is `[giving] in to the cretins' -- as Richard Nixon said, `solutions are not the answer'...).
I should have elaborated exactly how I would suggest Ofcom go about implementing the 192-redirect service. Anthony rightly points out that `cheapest' is ambiguous in the presence of complex price structures. However, Ofcom know or can find out what a `typical' (modal, presumably) directory enquiries call looks like: how long it takes, whether one or more numbers are looked up; whether the caller asks to be connected to the number that is found, and so forth. My guess is that the vast majority of callers request a single number then hang up.
Given pricing information -- no doubt communicated automatically to Ofcom via the medium of XML or whatever other bullshit data format is presently trendy in the telecoms industry -- Ofcom can determine which service is cheapest for the typical call. They can publish this information, and, as I suggest above, announce it to callers so that they know to whom they are being connected before they are charged anything.
Ofcom could do this evaluation automatically every day or week, and so an operator who dropped their prices below those of the current destination of the 192-redirect would automatically replace them. It's hard to see how this would encourage the inertia of which Anthony warns.
Naturally, there is a risk that the cheapest service wouldn't be very good; however, Ofcom presumably already monitor the quality of these services and we could add a clause to the evaluation above to restrict the tender to services which don't suck. In practice I'd be surprised if this matters, since I'd have thought all these people are going to be working from the same database of numbers and will be equally competent.
It would also be possible, in principle, for a provider to appear to be the cheapest for a `typical' call, then ramp the call charge up sharply after this. However, the tarriff types used by current operators don't include such a possibility among the four available. The closest is `two rate' (fee for first minute plus cost per minute of further call), but if most calls don't go beyond a minute, such a service mightn't be the worst choice; and if most calls did extend long beyond a minute, it's hardly likely that a service which ramps up its prices after the first minute would turn out cheapest.
Other objections are, basically, that nominating one provider -- even the cheapest -- limits choice. This isn't really true, since I'm not proposing that the other 118xyz services are abolished; simply that 192 becomes a shorthand for the service which is likely to be cheapest. It would still be possible to dial 118xyz to get a particular service.
There's a broader point here, too. The only purpose of opening the directory enquiries service to other providers is to improve service to the consumer, in this case by making it cheaper. Experimentally, we observe that competition often -- but not always -- has this effect. But advertising, consumer research and so forth aren't always necessary for us to benefit from competition. If the best provider in any given circumstance is well-enough defined -- as I believe is the case for directory enquiries -- then all we need is a service which selects the best one. Telephone companies (and large organisations with complex telecoms needs) already do this to buy long-distance capacity, and most users probably don't even know about it. 192 seems to be another example where the same principle applies.
(As a final note, I'd expect the hypothetical cheapest 192-redirect service to be free, but to play an advert before the caller gets their number. It would probably minimise personnel costs by using voice recognition whenever possible and poorly-paid people in call centers abroad when not. There would be neither bells nor whistles. I'd find the adverts bloody irritating and would use another service, but many others wouldn't.)
15 August, 2003: Yet more statistics
Some more updates on my Political Survey:
(One quick note. I am not a statistician; the procedures I describe below satisfy me intuitively, but I'd be very interested to hear informed criticism of them.)
Analysis so far indicates that only the first two axes in the data are significant. This is of itself a useful and interesting result.
To summarise, the procedure here is to create sample data which is uncorrelated but which has the same marginal distributions (for each statement) as the real data. The eigenvalues of the covariance matrix from the random data set tell us how large an eigenvalue can arise by chance. So we argue that the only eigenvalues from the real data which are significant are those which are significantly larger than the corresponding random-data eigenvalues.
Obviously we'll get different answers for the random-data eigenvalues for each sample random data set we use. So to make the above result robust, we should repeat the random sampling procedure and compute the mean and standard deviation of the random eigenvalues. This is done repeatedly until the mean and standard deviation converge.
My next concern is to determine how well-constrained the eigenvectors are. It's not obvious how best to do this, but what I've done now is to take random subsets of the data -- I've selected, for no very good reason, three-quarters of all responses -- and compute the eigenvectors and eigenvalues of the subsets. This then gives a mean and standard deviation for each eigenvalue and each eigenvector component. The eigenvalues can then be compared directly against the random eigenvalues, as above; we can also inspect the eigenvector components to judge how well-constrained each eigenvector is.
So, the results.
Eigenvalues
Here we plot the random eigenvalues, the eigenvalues obtained from the whole data set, and +/- one standard deviation eigenvalues taken from the three-quarter size subsets (about 250 are sampled to produce these results):
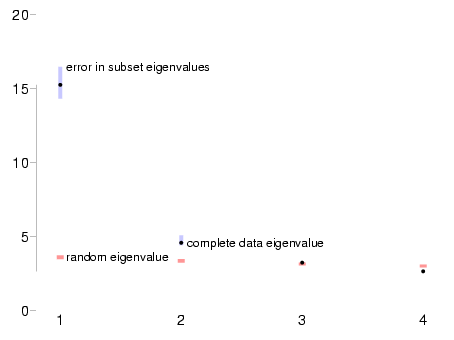
This confirms the statement above: the first two eigenvalues are significant, the first much more than the second; and the standard deviation of the eigenvalues is small, both by comparison with the difference between them -- meaning that we won't confuse eigenvectors 1 and 2 -- and compared the the difference between random and real eigenvalues -- meaning that it's very probable that these eigenvalues do represent real variability in the data.
(One thing I don't understand in this plot is that the eigenvalues derived from the complete data set -- shown by black dots -- don't lie on the mean of the eigenvalues derived from the data subsets. I don't understand why they shouldn't; it's possible that the sampling code hasn't converged properly. I don't think that this is a significant problem, though.)
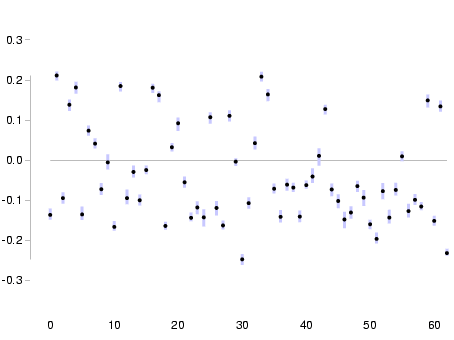
Eigenvectors
Next we look at the variation in the components of the first two eigenvectors. In these plots, the horizontal axis refers to the statement number, and the vertical axis is the size of this component of the eigenvector. The position of a respondent along this axis is given by the dot-product of their responses with the eigenvector; that is, the sum of the eigenvector components multiplied by the corresponding statement answers. So a large positive value for an eigenvector component means that an `agree' answer to the corresponding statement pushes you towards the positive end of the axis. (You can see the most important statements in the eigenvectors in the existing data report, though these will change slightly when I upload the newer version of the code.)
-
First eigenvector
-
Second eigenvector
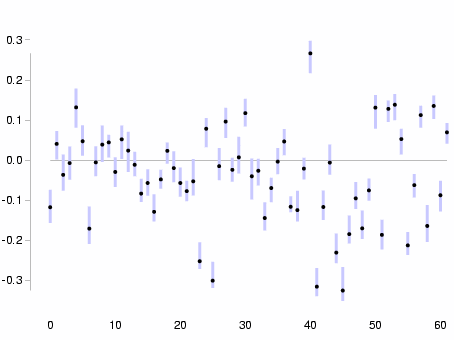
We can see immediately that the first eigenvector is quite well-defined -- the errors in the components are small by comparison to the sizes of the components; and the second eigenvector is poorly defined by comparison, but again the errors are not very large relative to the components.
A more intuitive way to look at this is to look at the angles between the subset eigenvectors and the eigenvector derived from the whole data set. So:
-
First eigenvector

-
Second eigenvector

In these plots, the black arrow represents the eigenvector derived from the whole data set. The blue region shows (a) the variation in the eigenvalue, as a variation along the length of the vector; (b) the variation in the direction of the eigenvector itself. The first eigenvector is well-constrained, varying on the order of 6.7° depending on which three-quarters of the data we use to derive it; the second eigenvector is more poorly defined, varying by around 16.76°.
Note that in both cases the variation in direction is much less than 45°, which suggests that we are not confusing the first two eigenvectors with others.
Hence, it seems reasonable to stick the results from these calculations into the results script and start displaying where respondents fall in the two-dimensional space defined by these eigenvectors. I'll try to do that later this weekend.
11 August, 2003: Little entitlement enlightenment
Some time ago I wrote to David Blunkett at the Home Office in an attempt to find out some more information about the identity cards scheme he is apparently determined to foist off on us. You can read a copy of my original letter (PDF format).
A little while ago I received a reply (slightly to my surprise, given my previous experience writing to Blunkett....)
Apart from poor grammar and the slightly staggering misspelling of my name at the beginning, the reply was mostly notable for not answering any of the interesting questions; early in the text is this disclaimer:
Most of the question [sic.] that you raise relate to the detailed management and administration of a possible entitlement / identity card scheme. These arrangements have not been decided yet and therefore there is only limited information that I can provide to you.
Anyway, here goes:
-
``How much will the card cost?''
No answer; instead, I am told that,
There is a range of possible costs depending on the sophistication of the card (i.e. whether it is a smartcard and if so how `smart' it would be). No decisions have been taken on any possible fee structure or the price of the card.
(The reference to a `fee structure' is interesting; everything I'd seen so far referred to a single price for the thing.)
-
``What will happen to members of the public who cannot afford to buy the card?''
People on low income may be given a card, or invited to pay by instalments, which seems fair enough.
-
``Can you give an example of a recent terrorist incident in a country without compulsory identity cards which would likely have been averted if cards had been available there?''
No answer at all to the most important question I asked.
-
``The use of biometric information for authentication is fraught with difficulties. In particular, it is impossible to revoke or issue new biometric information. How will the use of biometric information on the new cards address these problems?''
No answer. Question probably not understood.
-
``Some physically disabled people will not be able to use the biometric features in the card. How will the Government ensure that such people do not suffer from additional discrimination as a result of the proposed scheme?''
While I am assured that,
The Government would not exclude people who were unable to provide biometric information because of a medical condition.
no news on other forms of discrimination. (E.g., imagine that the cards store iris photographs with the intention that iris recognition is used for `authentication'. Now suppose that you're blind. Should you expect not to be able to use your bank's auto-teller because you can't be `authenticated' in this way?)
-
``Recent Government IT projects such as the National Air Traffic System and the system Individual Learning Accounts system have overrun and suffered serious failures. In the latter case there was substantial fraud. How will the Government ensure that the identity card computer system does not suffer from either cost overruns or security problems?''
This, perhaps, was an unfair question. I wouldn't have expected the Home Office to answer,
We fully expect the supporting IT systems for the entitlement card to sink into a morass of fraud, delays and misdesign. We envisage nominating a junior Minister to resign in disgrace once the amount of money wasted becomes publicly known.
-- instead, I got the much less entertaining
The Government will ensure that lessons are learned from past IT projects. Building on the existing passport and driving licence systems would help to reduce risks.
So that's alright then.
-
``One reason given for implementing an identity card system is that the United States would prefer us to have one for the convenience of their customs service. Will the data on the identity cards be available to governments outside the United Kingdom, and if so, how will those governments' use of it be governed by the relevant legislation on Data Protection?''
The answer here,
The Government will ensure that any entitlement card scheme will operate in accordance with the eight principles set out in the Data Protection Act 1988. The consultation paper goes into detail on how a scheme would comply with all eight principles.
The relevant principle is,
The Eighth Principle: Personal data shall not be transferred to a country or territory outside the European Economic Area unless that country or territory ensures an adequate level of protection for the rights and freedoms of data subjects in relation to the processing of personal data.
-- but note that `national security' can override these protections, and the United States government is likely to take the position that its use of identity card data is to ensure `national security'. So basically we will have no protection.
-
``Current practice in the United States shows that giving individuals an identifying number such as a `Social Security Number' has made identity fraud extremely simple, since all that is needed to assume another person's identity in a transaction is knowledge of the identifying number. Any centralised identity card scheme must, obviously, incorporate such an identifying number. Will this number be visible on the outside of the card or be disclosed to third parties under any circumstances?''
No answer.
-
``Will the scheme use `smart cards' which incorporate a cryptographic key-pair? If so, will the Government have knowledge of each card's private key?''
The answer here suggests a misunderstanding of the question:
The information stored on any electronic chip attached to the card would be a sub-set of the core personal information also held on the central register and displayed on the card.... The Government would look to provide a way for card-holders to view the information stored on the chip provided this could be done securely for example via a PIN number or by matching the card-holder's biometric information.
I suppose these answers are about what you'd expect if the design of the scheme really is in its infancy. This wouldn't be the first time that the claims made by politicians for a technology preceded the actual implementation of that technology by a wide margin. The absence of an answer to (3) in particular only confirms my belief that the Government doesn't actually know what identity cards will be useful for, but thinks that they will be useful for something or other.
9 August, 2003: Population context
So, a couple of days ago I mentioned a simple model of the UK population which I've produced to inform my views on the upcoming `pensions crisis'. (Why I wanted to do that is another story, best not dwelt on here....) Herewith some thoughts on the subject:
Background
Current pensions for retired people are funded out of the current output of the economy, because most of the goods and services which people consume in their retirement -- food, medical treatment, transport, etc. -- are perishable or can't be stored. So, there must be an `intergeneration transfer' of wealth from those who are presently working to those who are presently retired. If the number of workers producing output falls relative to the number of retired people, then there will be a shortfall in pensions. Such a fall in the ratio of workers to pensioners is expected to occur in the relatively near future, as people from the `baby boom' generation reach retirement age.
Superficially, it might seem that `fully funded' pensions, where each worker saves money to spend in their retirement, get around this problem. In fact, this is not the case; there's good discussion of why not in this paper by John Eatwell and this IMF paper by Nicholas Barr. To precis, imagine that you invest your pension payments in some sort of financial instrument (for instance, equities). The price of those shares is determined by the demand for them. Fast-forward to your retirement; now you need to sell your investments. Again, their price is determined by the demand for them, and that is determined by the number of people investing in pensions at the time of your retirement. If the number of workers saving for their pensions is smaller when you retire than at the time you are selling your investments, then your investments will drop in value. Similarly, if you save cash, then the increased spending by retired people will lead to inflation at the time that you retire (see pp8--9 of Barr).
The simple way to express this is through a model of output and pensions saving. Clearly, pension payments = workers' savings + tax spent on pensions; or, writing P for the average pension, N for the number of pensioners, S for the savings rate, T for the tax rate, Y for average annual output per worker, and W for the number of workers, PN = (S + T)YW. (Eatwell p4.)
The average pension that society can afford, P, is then given by (S + T)YW / N; critically, it depends on W / N, the ratio of workers to pensioners in the population. (It will also change with the sum of pensions savings and tax spent on pensions, and with the average output per worker, but shifting between savings and tax makes no difference.)
How will the ratio W / N vary over time?
A simple population model
Formally, model the population of the country as a density function p(a); a is age, and p(a)da tells us the number of people between the ages of a and (a + da). (Note that in principle we should model the male and female populations independently, but for a simple model we can just assume that half the population is male and the other half female.) The evolution of the population is then described by (d/dx are partial derivatives; HTML is lousy for maths...)
dp(a)/dt = - dp/da - d(a)p + i(a)
where d(a) is the death rate per person per unit time, and i(a) is net immigration per unit time. (Typically this is how the figures are quoted, and intuitively we expect the death rate to be per person but not the immigration rate.) We then need another equation to represent the birth of children:
dp(0)/dt = Integral[b(a)p(a) / 2, 0, infinity] - dp(0)/da - d(0)p(0) + i(0)
where b(0) is the birth rate per woman per unit time; the factor of two is there because only half the population are women.
The parameter of interest for the pensions problem -- the ratio of working-age to retired people -- is then given by
W / N = Integral[p(a), aw, ar] / Integral[p(a), ar, infinity]
where aw is the age people start working (18) and ar is the retirement age (65).
(Slightly less formally, imagine the population of the country divided by age into buckets, one for each year of age. The contents of the bucket next year is the population of the bucket one year younger minus the number of people who died plus the number of people who immigrated. For the very first bucket -- age zero -- we also add the number of people born. Since all the available data are done in terms of one-year -- or larger -- age buckets, we may as well just use a model which works on one-year buckets.)
Data on the initial p(a) -- the current population pyramid -- is summarised from the 2001 Census; National Statistics also provides data for death rates, birth rates, and immigration rates. Some of these rates are given over age ranges of greater than one year; in these cases we assume that the functions are uniform over each interval. (A priori, there's no reason to do otherwise.)
Given this, we can use the model to make predictions of what the population will do in the future. We make the simplifying assumption that birth, death and immigration rates do not vary with time. Obviously they will, but again it is best to make the simplest possible assumptions.
(If you're interested, you can get the code for the model and the script which makes the plots below.)
Illustrative results
Here are population pyramids, with rates of birth, death and immigration fixed at current levels:
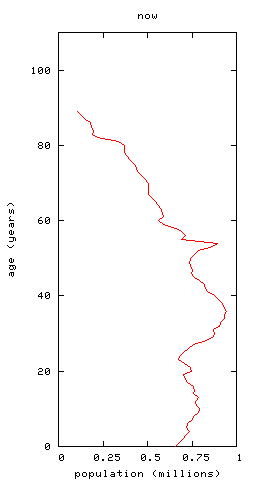
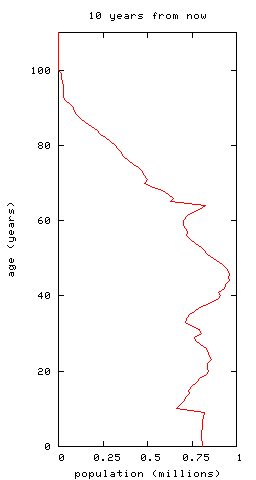
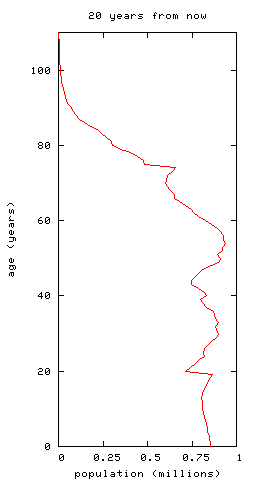
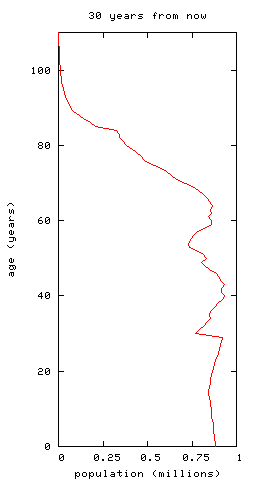
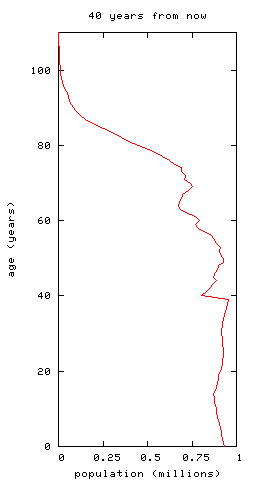
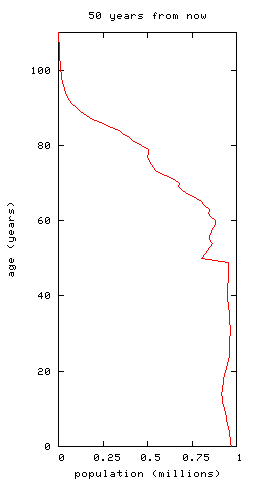
-- you can see the bulge of people now aged 30--40ish moving up to retirement age. To illustrate this further, plot the ratio of workers to pensioners we predict, again with fixed birth, death and immigration rates:
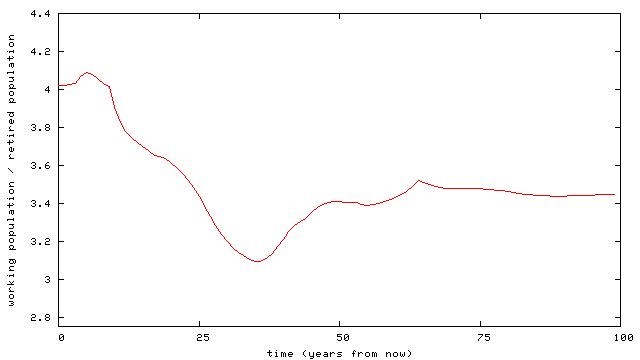
Presently, there are 4.02 times as many workers as pensioners. This will drop by 23% to 3.09 in 35 years' time, meaning that -- at current rates of output -- average pensions will also drop by 23%. (This is slightly larger than the prediction in the Eatwell paper, which is about 19%, but of the same order.) It will then rise again, but -- in the steady-state model here -- it will not again reach anything like its current value, instead settling at 3.44, about 14% below today's value.
Two ways to improve the situation are to increase birth rates or to allow more working-age immigrants into the country. What effects do these have?
First, birth rates:
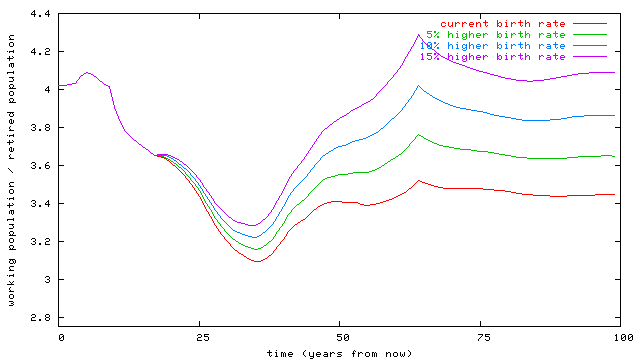
Note that this has no effect until today's children start to enter the workforce, and children only gradually feed into the workforce. We can plot the worst workers/pensioners ratio in the trough as a function of increase in birth rate:
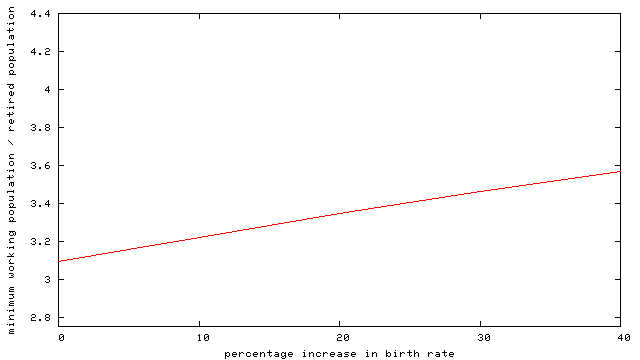
-- even by increasing birth rates by 40% -- which is unreasonable -- we can't keep the workers/pensioners ratio at or above its current value.
Second, immigration:
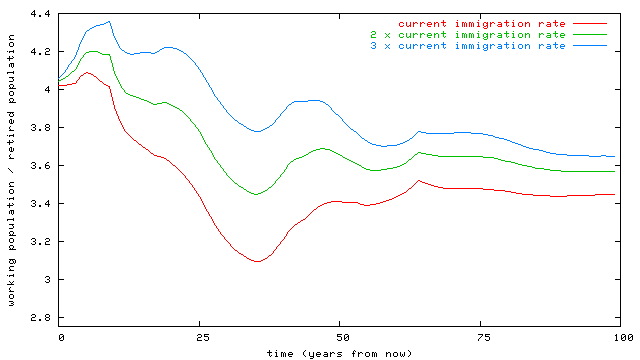
As we increase the immigration rate, the trough becomes shallower and the long-term ratio rises. Plotting the depth of the trough as a function of immigration rate:
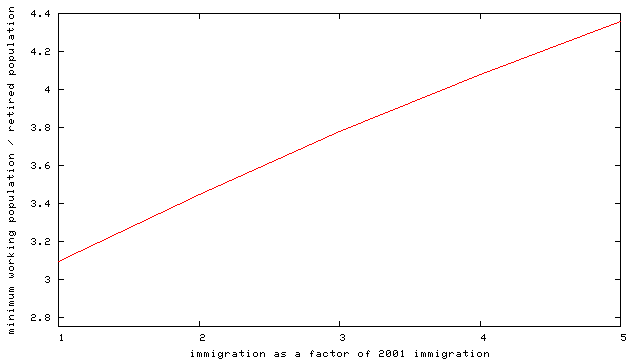
-- we see that increasing immigration from its current rate (about 180,000 per year) to three to four times that value will effectively eliminate the thirty-five year trough in the workers/pensioners ratio. There will then be another trough about sixty years hence, but (a) it's not very deep; and (b) it's very questionable to extend these predictions so far into the future.
What about economic growth?
So far we've ignored this. Clearly, if productivity (output per worker) grows, then the situation improves, since fewer workers can support the same number of pensioners, keeping pensions at their current level in real terms. At current rates of birth, death and immigration, we need productivity growth of 23% over 35 years, or about 0.5% per year, to keep pensions at their current real value.
It turns out that the long-term forecast for UK productivity growth is something like 2.1%, much higher than this minimum and more than enough to maintain the real value of pensions in this simple model without changing the saving or tax ratios.
This confuses me. If productivity does grow as predicted, then there will be no `pensions crisis', since the increased per capita output of the economy will compensate for the decreased number of workers. Pensions will, in real terms, be smaller as a proportion of wages than they are now, but it's not obvious how much that matters.
More here when I've done some more research.
7 August, 2003: Peter Cuthbertson is an ignorant lying brat
(This really oughtn't to be of interest to anybody, but the title should look good in Google....)
Never wrestle with a pig.
You both get dirty, and the pig likes it.
Tory boy web logger Peter Cuthbertson, whose idiotic post on immigration I mentioned earlier has now deleted comments I made to his weblog with which he disagreed -- less than twelve hours after saying,
I don't edit away debates as you seem to think
Since he's quick to see hypocrisy in others, I thought it might be useful to document this. Here are four copies of the comment transcript showing Peter's editing in sequence: 1; 2; 3; 4.
Sad, really. But then this is the same person who believes that an international lobby of homosexuals is conspiring against civil rights, that Augusto Pinochet was an alright bloke, and that eeeevil foreigners are organising to overwhelm the country by voting for the Euro in a referendum -- the same person, indeed, who makes the age-old mistake of believing that copyright infringment is theft, doesn't know what fair dealing is, and believes that it's sensible to assign copyright in his web log to his internet service provider! (``© Copyright 2002-2003 Re4lity & Peter Cuthbertson'' -- see bottom of cached page in case he acquires an ounce of sense and changes it.)
I wonder if his work appears as a net asset or a liability on Re4Lity's balance sheet?
Update
Apparently, I am a `blogroach'. I should thank ignorant lying brat Peter Cuthbertson for exposing me to another neologism from the sordid cesspit of right-wing `debate' on the Internet.
(I note in passing that -- whereas above I say that the ignorant lying brat assigned the copyright in his work to his ISP, he says that,
Re4lity is my very fine host, not my ISP.
-- if, as he implies, they don't `provide' a `service' on the `Internet', you have to wonder what he's paying them for. Oh well, it's quite obvious that Peter doesn't know much about this whole inter-web-thingy.)
More updates
Peter is still deleting comments from his weblog. It's almost as if he's establishing a pattern of behaviour. Yesterday, Pete (no relation!) posted,
Peter
Thats a very intriguing comment. Here Chris alleges that you are lying about deleting his posts and he has four grabs of your site at different times with his comments variously going missing.
Now assuming you are right that you don't edit comments out of the page then it's reasonable to assume that this comment won't go missing, and therefore to demonstrate that I've taken a grab of your page and put it up here.
However, I'm inclined to believe that Chris has a point because I recall seeing his comment that began ``Oh dear. Peter is still deleting my comments. How dull of him.'' yesterday afternoon when I was browsing your site -- around 5.30pm. That comment is no longer here.
Of course, if you remove my comment from this page I'll have documented evidence that you do in fact delete posts you don't like.
Needless to say, ignorant lying brat Peter Cuthbertson has removed the comment -- apparently, even in small quantities, the truth hurts.
6 August, 2003: Same old same old
One more quick comment on the Political Survey -- I've now written some code to estimate which of the eigenvectors are significant. The basic idea is that we generate synthetic data using the marginal distributions for each statements -- that is, like the data which would have been produced by the same number of respondents as have completed the real survey, but as if their answers to any one question were unrelated to all the others; and having done that, we perform the principal components analysis on the synthetic data. The idea here is that we can compare the eigenvalues from the synthetic data to the eigenvalues from the real data. If the real eigenvalue is significantly larger than the one from the synthetic data, it likely represents real variation in the data; otherwise, random variation.
Here's how they turn out:
| n | real data eigenvalue | synthetic data eigenvalue | caricature |
|---|---|---|---|
| 0 | 12.770 | 4.243 | Daily Mailism |
| 1 | 4.863 | 4.202 | Social Liberalism |
| 2 | 3.860 | 3.997 | ? |
| 3 | 3.569 | 3.766 | |
| 4 | 3.187 | 3.603 | |
| 5 | 2.838 | 3.440 |
-- suggesting that the first two eigenvectors are significant, but none of the others. It's possible that this could change with more data, but I don't really expect it to. So the first actual result is that two axes are sufficient to describe the data we have so far.
The next check I need to do is to determine how well-constrained the eigenvectors are. More thoughts on that later.
And more flaming
I seem to have been having an argument with Peter Cuthbertson (see end of page), which is pretty futile; but it has provoked me into producing a toy model of the UK population, which I might say something about at some later stage. I was using this to calculate the ratio of working age people to pensioners, on the basis that Cuthbertson apparently doesn't believe that immigration can affect this. Anyway, the resulting graph:
The model itself is pretty simple; you can get the code here.
5 August, 2003: One in, one out
As ever, I should probably refrain from commenting on the breathtaking stupidity of other web loggers, but I was so incensed by this rather unpleasant post by self-styled `conservative commentator' Peter Cuthbertson that I couldn't help myself. (Update: Peter Cuthbertson is an ignorant lying brat.)
Cuthbertson has `written' an `article' by cutting-and-pasting some points from this rather thin rant on immigration from The Spectator. Cuthbertson refers to the Spectator article as `another great piece' because he agrees with it. Which is sad, because it's total crap.
Let's go through the points one by one:
- Mass immigration hugely exacerbates the housing crisis.
- Britain is already overcrowded: it is one of the most densely populated islands in the world; twice as densely populated as France and eight times as densely populated as America -- and increasing population density damages quality of life.
These two are, of course, the same point, but splitting them up makes them look more impressive. Well, until you read them, I suppose.
The first thing to point out is that there is no `housing crisis'. There is a shortage of housing in some parts of the country, but that could be solved in a matter of months by building new houses. This, of course, would be unpopular -- chiefly among existing home owners who hope to benefit financially from house price inflation -- but that doesn't make it a crisis.
Secondly, it doesn't mean anything to claim that the country is `overcrowded', except in context. Peter makes an uninformed attempt to provide context by his claim that increasing population density worsens quality of life. Let's actually look at some statistics:
| Country | Area (square km) | Population | Population Density (per square km) | GDP per capita ($ in PPP terms) |
|---|---|---|---|---|
| UK | 244,820 | 59,778,002 | 244 | 25,300 |
| Sweden | 449,964 | 8,876,744 | 19.7 | 25,400 |
| Belgium | 30,510 | 10,274,595 | 337 | 29,000 |
| USA | 9,629,091 | 280,562,589 | 29.1 | 36,300 |
| Switzerland | 41,290 | 7,301,994 | 177 | 31,700 |
| France | 547,030 | 59,765,983 | 109 | 25,700 |
| Japan | 377,835 | 126,974,628 | 336 | 28,000 |
| Singapore | 692.7 | 4,452,732 | 6428 | 24,700 |
| Germany | 357,021 | 83,251,851 | 233 | 26,600 |
| Ireland | 70,280 | 3,883,159 | 55.3 | 28,500 |
(We use GDP in purchasing-power-parity terms as a measure of quality of life. This is perhaps of arguable utility, but there is little else to work with. Data from the CIA World Factbook, so E&OE!)
Here's a plot of these figures:
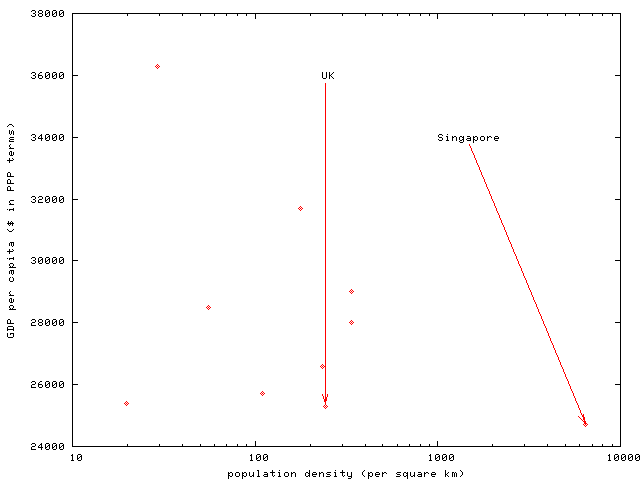
(Note logarithmic scale.) It's clear that there is, among this set of countries, no relation between population density and quality-of-life. In particular, countries with approximately the same GDP per capita as the UK stretch over a population density range of about 20 per square km to about 6,500 per square kilometer -- a factor of more than three hundred. (This is what you'd expect intuitively, since we could imagine carving out bits of the country -- say, central London and rural bits of Yorkshire -- and separately calculating their GDP and population density figures. This would give us a big range of population densities but a much smaller range of GDPs per capita.)
- Mass immigration -- as opposed to limited immigration of skilled workers to meet shortages -- damages the employment prospects of those already here, particularly the unskilled.
Would Cuthbertson make the same argument about adding `unskilled workers' to the population by other means, for instance natural increase? Unlikely. So what's the difference here? In any case, as anecdotal evidence suggests -- see, e.g., Fran Abrams's Below the Breadline -- many of the jobs taken by immigrants are ones which no `natives' are prepared to do.
- Imposing mass immigration on a society that doesn't want it damages relations between the communities that are already here ... [which] forces voters into the hands of extremist parties such as the British National party.
Of course, there's no reason that immigration should `damage relations' between communities that are already here, though being told again and again that it will undoubtedly doesn't help.
- Mass immigration increases inequality in society by increasing the wealth of those who employ immigrants (who tend already to be rich) and reducing that of those who compete with them (who tend to be poor).
It's always nice to see right-wingers wringing their hands about `inequality in society'. In fact the claim here is in some sense true, though the significant income inequality is between new immigrants and those who have been in the country longer (see for instance this paper on the situation in Canada which measures inequality among various immigrant and non-immigrant populations) rather than between immigrants and those employing them.
But it's hard to see how this is a problem. After all, immigrants -- who are, after all, choosing to come here -- know what they're getting themselves in for (or ought to). This is how the free market works. If people won't do significantly better by leaving their home and making a new life in a different country, they presumably won't do so. Since Cuthbertson is obviously opposed to immigration, he should see this as a good thing.
- Mass immigration is no solution to an ageing society, because immigrants grow old at just the same pace as non-immigrants. One of the country's top pension experts, Professor David Miles, said that trying to solve the pension crisis by importing more people is ``madness''.
I can't find the Miles comment so it's not possible to establish the context in which he said it. The other claim, that introducing immigrants to the population ``because they grow old at the same pace as non-immigrants'' is breathtakingly stupid. Imagine replacing `immigrants' with `children':
Having more children is no solution to an ageing population, because children grow old at just the same pace as adults.
Moving on,
- Mass migration of unskilled workers promotes low-skilled, low-wage industries and reduces economic productivity.
This is basically the same as (3) and (5). Again, many of the jobs being done by unskilled immigrants are jobs which non-immigrants won't fill -- it's hard to see who that's going to damage. Will it `reduce economic productivity'? Well, that depends on what jobs the immigrants actually do. It's certainly not obvious from the claims above.
- Much if not most of the supposedly temporary migration -- such as student visas, holiday working visas and seasonal agricultural workers -- is permanent.
This isn't an argument against mass immigration. If you think that mass immigration is a good idea, then you won't care about it; if you don't, hearing this will make you go all purple and start thrashing about with your copy of the Daily Mail. Either way it's not germane to the argument.
- White flight is ghettoising Britain's cities and fragmenting communities.
Apart from the fact that `ghettoising' is an extremely ugly word, this is just racism.
(The comments on Cuthbertson's piece are worth reading too, if you want to get a taste for the level of contemporary right-wing debate on the internet. Particularly amusing is the argument about pensions, wherein a large collection of morons fail to understand a trivial -- and fundamental -- bit of algebra. Nevertheless, they pontificate at length about pensions policy.)
In other news
I saw Buffalo Soldiers -- a fairly entertaining military heist movie. Watching it put me in mind of an incident related in a (vaguely entertaining) book called Marijuana Time. in which the author, Ken Lukowiak, describes a training film intended to warn soldiers in the British Army of the dangers of narcotics:
After a fade to black we next find our two sergeants out in the woods on a NATO exercise. Sergeant No-No's taking the Warsaw Pact threat seriously and is charging around in an efficient manner, doing military-type things with his map and compass. Sergeant Spliffy, on the other hand, he's hiding away behind a tree and having a qucik puff on the old `wacky backy'.
Bet before he can get down to the roach, the command comes through to move out. Sergeant Spliffy grabs a last deep toke on his joint, then another quick one for luck, and leaps into his tank. At the same time Sergeant No-No climbs behind the wheel of his Land Rover and immediately starts issuing orders over the radio. In the notional battle that follows, dopehead Sergeant Spliffy is so off his face that he drives his tank right over his best friend's Land Rover, killing poor old Sergeant No-No instantly. The End.
... What I do know is that [the makers of the film] would have been very disapointed with our group's reaction to it all. For our conclusion was that the German girls doing the tempting were such drop-dead shakeable babes that we'd have smoked heroin if we'd thought it would help us get into their knickers. Mind you, none of us drove tanks, did we?
Anyway, Buffalo Soldiers is highly recommended, as is Good bye, Lenin! -- it's pretty unusual to see two good films within a week of one another, and even more odd that both of them are set at the same time in roughly the same place....
