So, as you may have noticed, Downing Street Says has been getting some excellent publicity, quite a lot of traffic, and some interesting discussion. (The rest of this post is a introspective and self-congratulatory, so can probably be ignored. However, it does contain graphs -- yay! -- and even some actual maths, so it's not 100% content-free.)
So, here's a plot of traffic to the Downing Street Says site on Monday afternoon:
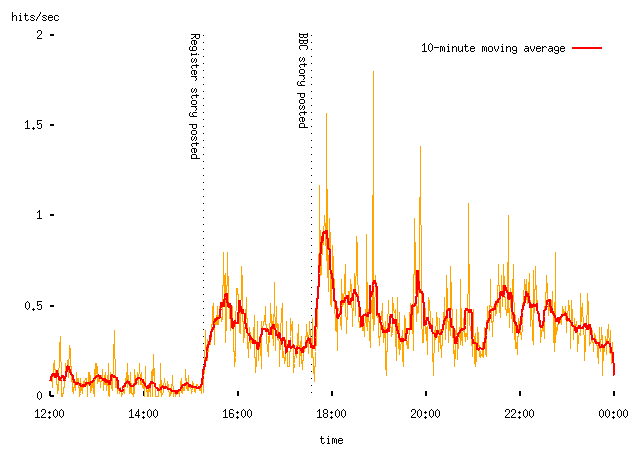
-- this counts page views, rather than visitors (fewer) or HTTP transactions (more). The yellow line shows the request rate in one-minute buckets (that is, the number of matching log lines in that minute), and the thicker red line is a symmetric moving average of the raw data. I've marked the times that we first saw hits from the story in the Register (the actual time of posting on the story was a bit earlier) and the time that the BBC News story appeared. Obviously each of these stories drew visitors to the site. The pattern of traffic after each story was posted rather resembles that which I got after my Political Survey was featured in NTK:
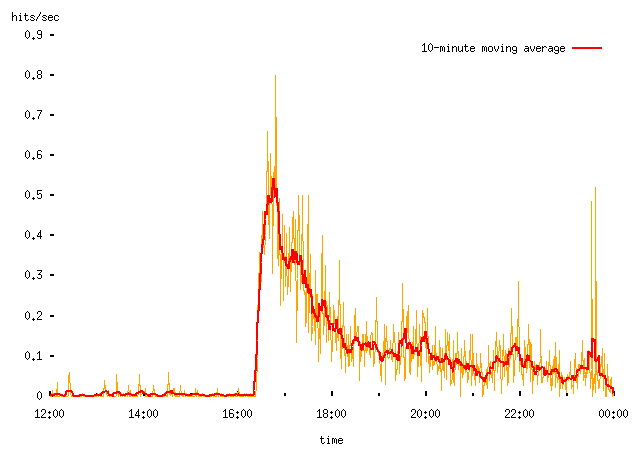
-- and this seems to be characteristic of what happens when a link to some other page is first featured on a popular website. (Note different scales on the two plots above, and also that I've adjusted the Political Survey figures relative to when I last posted them to account for the difference between page views and total traffic, which is what I plotted before.)
What determines the form of this traffic spike? (See, told you there would be actual content....)
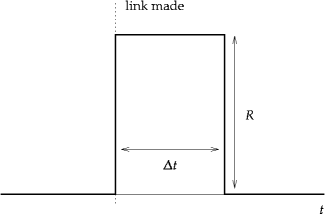
Suppose that N people visit some website every D seconds. At some point, that website posts a link to a second website. The first time any visitor to the first website sees this link, they follow it. Assume also that, while the N visitors all check the first website regularly, they do so at different times uniformly distributed over any period of length D. The second website will then see, in the time after the link is posted to the first site, a stream of visitors arriving at some fixed rate R for a period D:
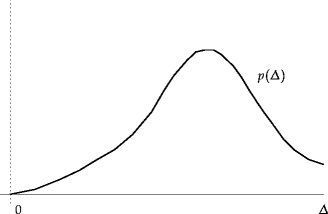
Obviously real websites don't have N visitors who all check the site every D seconds. So imagine a distribution p(D) of visitors, so that we have N0 in total with N0 p(D) dD checking the site at intervals between D and D + dD:
Now the traffic seen by the second site will be a sum of lots of `top hat' functions, one for each possible check interval. I've written out the maths separately, but basically you get something like this:
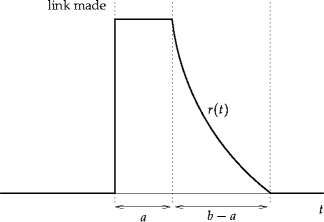
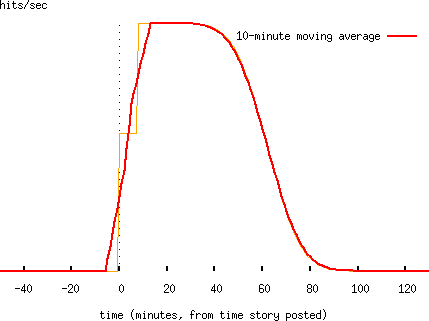
(that particular example is for a flat distribution of check intervals in a < D < b). The thing to note about this function is that it leaps from zero to its maximum at the time the link is posted, and declines after that.
On the face of it, this is a bit surprising, though given the model you can think of it like this: in the first minute after the link is posted, all the people who check the first site every minute follow it, as do half of the people who check it every two minutes, one third of the people who check it every three minutes, and so forth. In the second minute, half the people who check every two minutes follow it, as do one third of the people who check every three minutes, one quarter of those who check it every four minutes, and so forth. Of course, there aren't that many people who check even the most popular websites every minute; in fact the spike will be dominated by the center of the distribution.
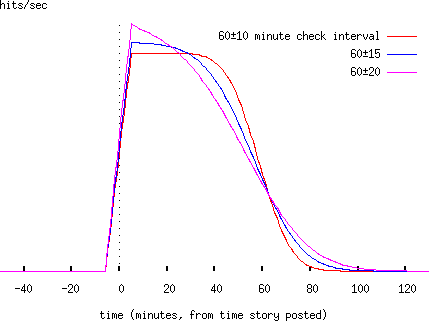
Where visitors check a website at normally-distributed intervals, we get spikes like this (this has visitors checking the website at a mean interval of one hour, and a standard deviation of ten minutes; note that a normal distribution can only be an approximation here, because the check interval must be nonnegative, which is not true of a normally-distributed variable):
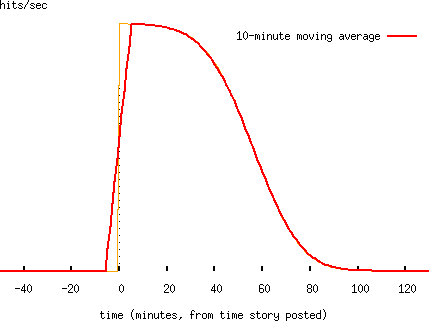
Note that in the traffic plots, I take a ten-minute moving average of the data, since traffic data are very noisy, and it's quite hard to pick out any meaningful trends without doing so. So the instant ramp-up of the spike is spread out over about ±5 minutes either side of the time the story is posted.
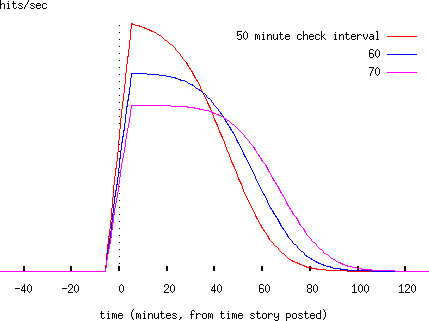
Varying the mean check interval and the standard deviation both alter the height and length of the spike:
Note that if we try to fit one of these spikes, there will be a trade-off (covariance) between the mean and variance of the underlying distribution, and therefore ambiguity in the results we obtain.
Is the theory borne out in practice? (Both plots of moving average page views.)
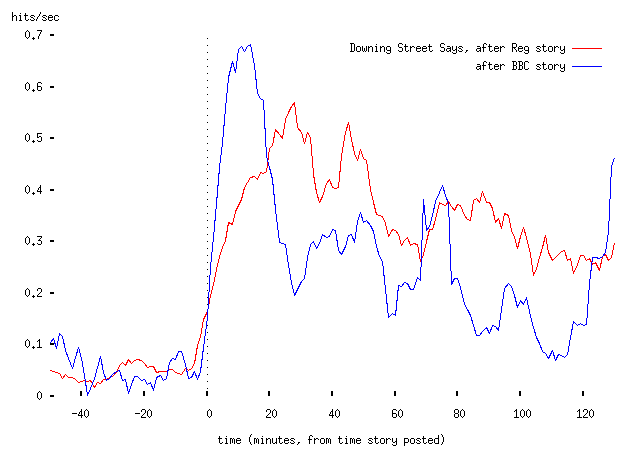
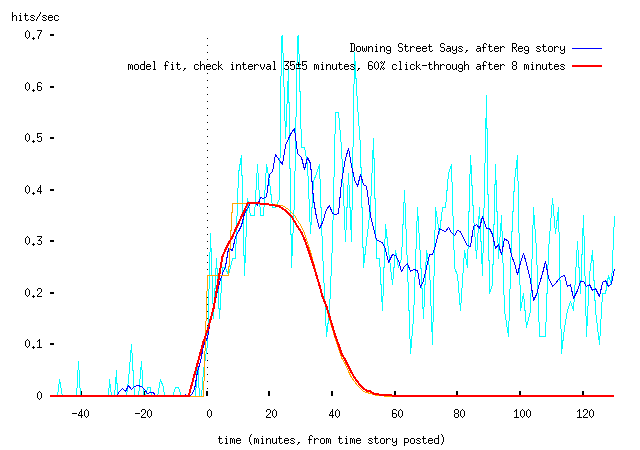
The posting of a link from the BBC site to Downing Street Says certainly resulted in a sharply-rising spike of traffic which fell off after a little while (note that the model only handles the first page view; obviously we expect to get a chain of hits from users who explore more than the front page of the site, but we don't model that). The Register's story resulted in a much less sharp rise, which the theory does not explain. More on that in a moment.
We can fit the model to the data; I've done this in a fairly Mickey-Mouse way, because basically this isn't going to tell us anything very exciting, except that the theory is kind-of-reasonable. The parameters extracted from the fit won't be well-constrained at all, and anyway this is a rotten way to obtain them. Anyway:
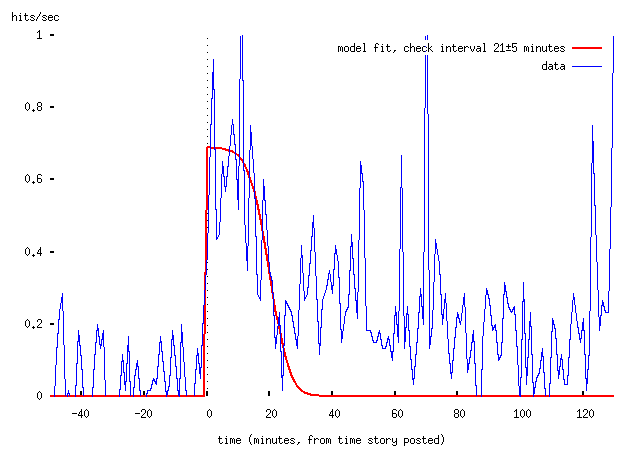
Or with moving averages, which is easier to read:
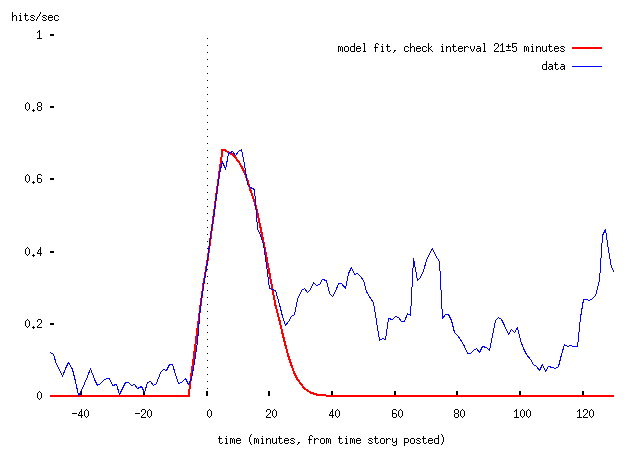
-- that is, we get a good fit (by eye, not properly) by assuming that visitors to the BBC website check it on average every 21 minutes, with a standard deviation of about 5 minutes. (Obviously this is restricted to those visitors who then went on to click through to Downing Street Says.)
To my slight surprise, the NTK data can also be modelled in the same way:
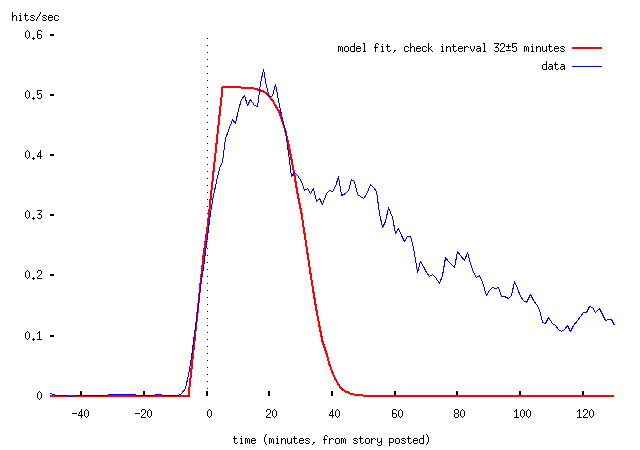
-- the reason that this is surprising is that (at a guess) most NTK readers get the thing as an emailed newsletter, rather than by periodically checking the NTK website (this may be wrong, of course). But the explanation here is presumably that most users receive email by polling (using a protocol like POP3) rather than having it delivered directly to their machine (using SMTP or modern IMAP implementations). Under this assumption, the model looks exactly the same; what we're measuring here is the regularity with which NTK readers' email clients poll for mail. Again, the 32±5 minutes figure isn't to be taken very seriously (and I'm surprised that it's so long).
So, the one bit of this I don't understand is why the load spike from the Register story ramped up more slowly than that from the BBC story (or from when the Political Survey was featured in NTK). One possibility is that the Register initially linked to the about page, rather than the front page. If we assume that most of the people who clicked through from the Register story read the about page, then clicked through to the front page -- and that's a pretty simplistic assumption -- then we would expect to get two spikes. Once the moving average is applied, we might get what looks like a shallower slope. The about page is about 2,000 words long, and the average reader reads about 250 words per minute, so would take eight minutes to read it. This gives something like this: (this is for a check interval of 60±10 minutes, with two page views separated by eight minutes, with 80% of the visitors to the first page clicking through to the second)
By extending the model to contain both spikes, we can obtain a sort-of-plausible looking fit:
but this model now has so many free parameters that it can't be taken very seriously. It also does't explain anything after the onset of the spike adequately, but one could imagine extending it for a series of spikes. By that point the model would have so many free parameters as to be completely worthless.
And that concludes your scheduled discussion of slightly eccentric statistics....
(Appropriately enough, the signature my email client attached to this post was,
Glory may be fleeting, but obscurity is forever.
-- clearly my random number generator is telling me something I don't know....)