
So, many thanks to the thousands of people who have now completed my Estimation Quiz. Special thanks to Michael Williams, who posted a link to del.icio.us, Dave Weeden, Chris Bertram of Crooked Timber, Nick Barlow, Chris Brooke, and many others for linking to the site, including a user of Metafilter -- which link drove most of the traffic. (I was expecting to have to wait months for enough people to complete the thing for the results to be interesting, as with my Political Survey. Instead it took two days. That should probably tell you as much as you need to know about my ability at estimating things.)
So, when I posted the link to the quiz, I said that I had an ulterior motive for building the thing. Michael Williams speculated that my purpose was to,
do something terrifying with the data.
I'm not sure whether the below will actually terrify you, but I'll try my best. (There's quite a lot to say, and some will have to follow tomorrow.)
For those who didn't do the quiz, I'll quote from the description:
How far is it from Edinburgh to Cardiff? When did the English Civil War break out? How long does light from the sun take to reach the Earth? You probably have some idea of the answers to questions like these -- or you could make a guess. But do you know when your guesses are right, and when they're wildly off?
This is a general knowledge quiz which tests you on how well you can answer questions like these -- and whether you know how good your guesses are.
For each question, you will give an answer in the form,
a ± ba should be your best guess at the answer. b is your idea of roughly how far off your guess might be. If you're absolutely sure of the answer, you can tick ``this is the exact answer''; but if you do, and you are wrong, your score will suffer.
You get points for how good your guess of a is, and whether b was an honest estimate of how wrong you were.
The quiz asks for estimates of thirty-one quantities. Most are straight general knowledge questions, for instance,
- [How many] bones [are there] in the adult human body?
- [How many] MPs [were] elected to the House of Commons at the 2001 General Election?
- [What fraction] of the population of the United States [are] below the poverty line?
Others require more specialised knowledge, such as,
- [How many] stars [are there] in the galaxy?
- [What is] the distance from the Earth to the Moon?
- [How long does] light from the Sun [take] to reach the Earth?
And some ask for things which few people are likely to know, but which are very easy to estimate, for instance:
- [How many] plastic carrier (shopping) bags [are] used each year in Australia?
- [How many] petrol stations [were there] in the UK at the end of 2001?
(I hadn't realised that the term `carrier bag' isn't understood to mean a disposable plastic shopping bag outside the UK. I adjusted the wording of the question when I discovered people asking, ``what's a carrier bag?'' In fact the quiz as a whole was rather Anglocentric, basically because I expected it to be answered by this web log's half-dozen readers -- mostly in Britain -- and their friends. The results below incorporate data from about 3,000 responses.)
Note that some of the quantities -- like the three astronomical quantities above -- vary or aren't actually known exactly. More on this later.
So, the first question you might ask is, ``are people actually any good at estimating things?'' The answer is that... it depends.
For some quantities -- especially ones which some respondents actually do know exactly -- the crowd's wisdom isn't bad. For instance, asked to estimate the latitude of London (51.5°N, but ±0.1° or so because London's quite big), the results look like this:
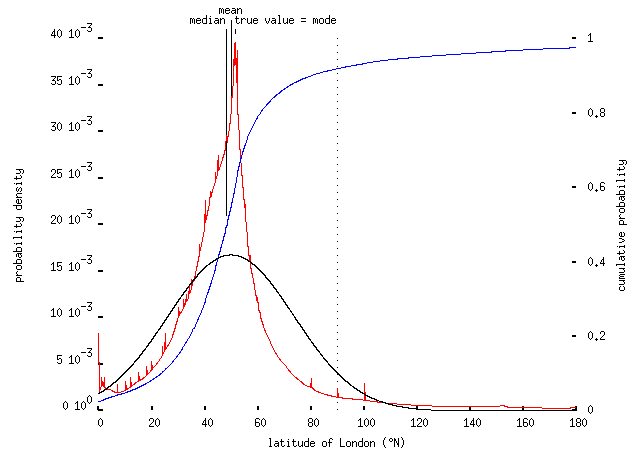
What I've done in this and the plots below is to combine the results from every answer to the question. Every answer x±dx is treated as specifying a normal distribution having mean a and standard deviation b; the combined distribution is the sum of all those distributions, divided by the number of responses. Answers which are exact (i.e., with b = 0) appear as single, thin spikes on this plot, like those at 0°, 80°, 90° and 100°. The red curve tells you, roughly, `how probable is this value for the latitude, according to the combined opinion of the respondents?' The blue curve is the corresponding cumulative distribution; it tells you `what fraction of the respondents think that the latitude is smaller than this value?'
So, the peak of the distribution -- the mode, the most frequent value cited by the respondents -- the middle (median) value, and the mean, all lie close to the correct answer; and the distribution is quite strongly peaked -- for comparison, the black curve shows the single normal distribution having the same mean and variance as the red curve. This obviously isn't an efficient way to find out the latitude of London -- to design the quiz, I looked it up in Google just like anyone else would (and just like some of the respondents no doubt did, despite strictures against cheating in the rubric) -- but at least the technique works.
Note also that about 3% of people thought that the latitude of London was 0° -- suggesting that they're confusing latitude and longitude -- and that about 8% of them thought that the latitude was more than 90°N. Well, they're in good company. Even some trained economists don't understand what latitude is.
Similarly, despite attempts by the gutter press to incite mass hysteria about immigration and asylum, some respondents had a decent idea of how much money ``scrounging'' asylum seekers receive in benefit: £37.77 per week:
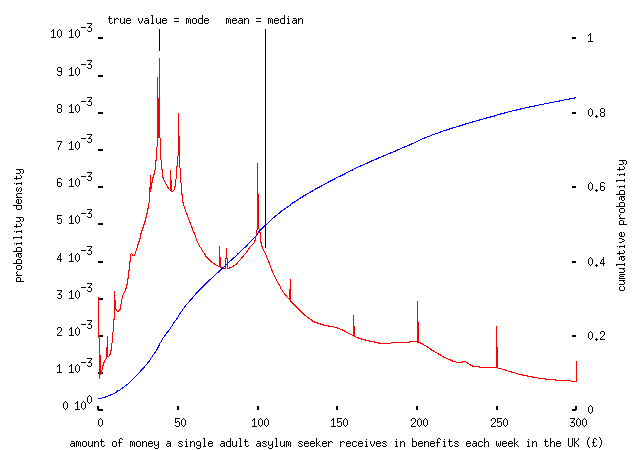
but many others did not: more than 80% overestimate the amount; about 50% believing that asylum seekers receive £100 per week or more, with 16% believing that they receive more than £300 per week, an error of more than a factor of ten. (Note, of course, that these results do not come from anything which resembles a representative sample, especially not a representative sample of the UK population. Nevertheless I was shocked that about 3% think asylum seekers receive more than £1,000 per week, though clearly some of these -- like the person who answered `2345' or `323232' were taking the piss.)
One thing you might ponder at this point is whether asking people to estimate their uncertainties actually makes any difference. Here's a version of the above plot, with an added purple curve -- the empirical cumulative distribution of the answers, ignoring uncertainties -- and a brown curve, giving a smoothed (`kernel density') approximation to the distribution of answers:
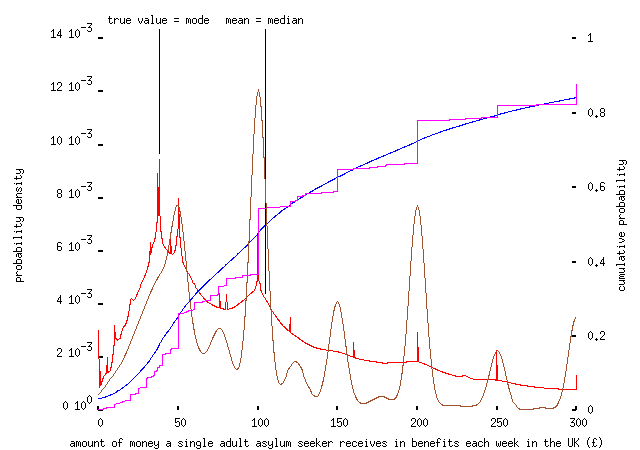
While the two distributions are fairly similar, ignoring the uncertainty information clearly decreases the accuracy of the estimate. (Note also how the brown distribution is peaked at round numbers; this isn't true of the distribution incorporating uncertainty information, because most people who pick £50 or £100 or whatever obviously know that they're guessing, and put in sensible error bounds.)
The crowds turns out to be pretty decent at guessing dates. For instance, asked to identify the start of the English Civil War (1642), they came up with,
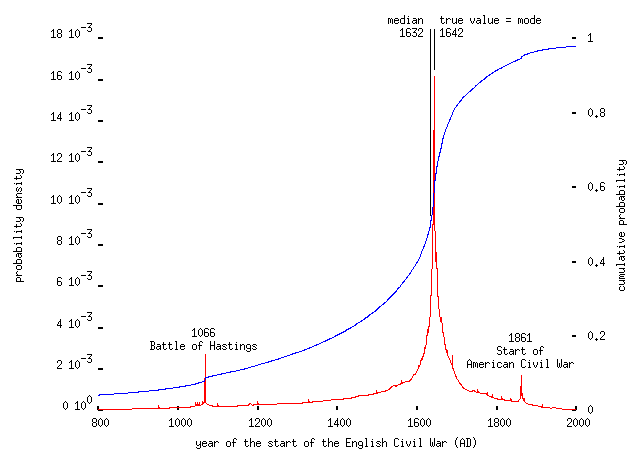
Note that, as Sellar and Yeatman pointed out a long time ago, for many people 1066 is the only memorable date in English history, and they're prepared to state it without uncertainty as the date of any significant event (many people gave 1066 as the date of the 1707 Act of Union, too). I don't know whether the same is true of 1861 for Americans, or whether that was a misunderstanding about precisely which Civil War was in question here. Asked to identify the date of the first space flight by a woman (1963), respondents suffered the same problem:
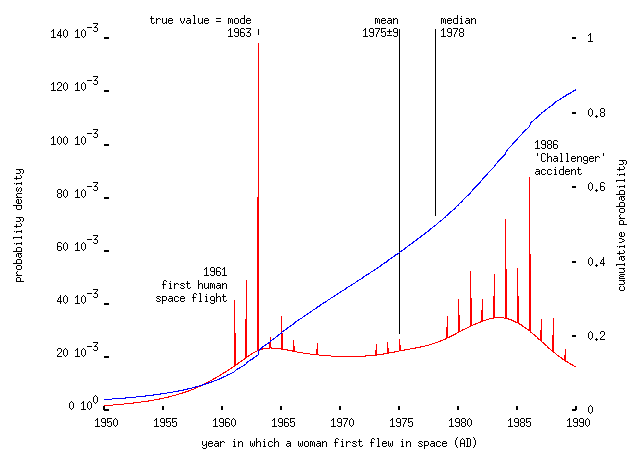
Here other popular choices -- memorable years in space history, so to speak -- included 1961, the year of the first human spaceflight, and 1986, the year of the `Challenger' space shuttle accident which killed seven astronauts. Given this I was slightly surprised that 1969 (the year of the first moon landing) wasn't a more popular choice.
(The results for the question on the height of the Eiffel Tower had a peak at 1,789 feet. This suggests the following splendid thought process: `the thing was built by the French to celebrate something French; that can only be the French Revolution; that happened in 1789; so I must be expected to know that the thing was built to be 1,789 feet high'. It's a nice idea -- full marks for imagination -- but sadly (a) the technology of the time wasn't up to building a 1,789-foot-high tower, and (b) it would have had to be a round number in meters, you parochial bastards! Many others said that the tower was 300 feet high, suggesting a units confusion which may have been partly my fault. On another question, asked to give the time taken for light from the Sun to reach the Earth, this `nice round number' effect led many people to state with absolute certainty that the time was some integer number of minutes.)
Moving on, it's hard to describe the `crowd's' response to other questions as anything like `wise'. `Haphazard' is nearer the mark. People know the distance from the earth to the moon surprisingly well, but haven't a clue about the length of the Nile and very little idea of the distance from Edinburgh to Cardiff. They have no idea at all about the GDP of the UK:
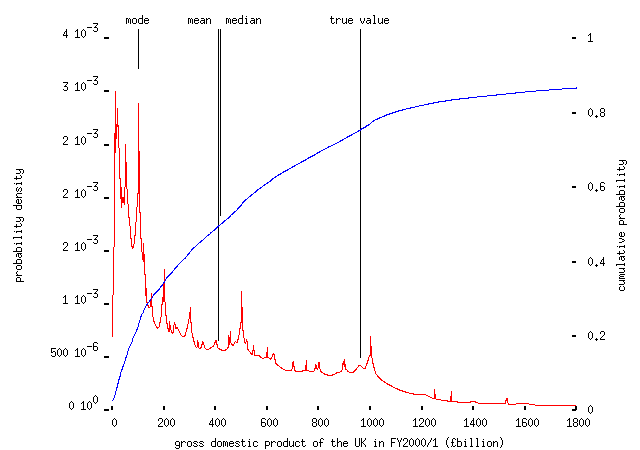
the most popular answer being about a tenth of the true value. Asked to estimate the number of words in Pride and Prejudice -- I was going to ask about `a typical novel', but of course there's no such thing, so I had to pick one everyone would have heard of -- left the crowd totally stumped:
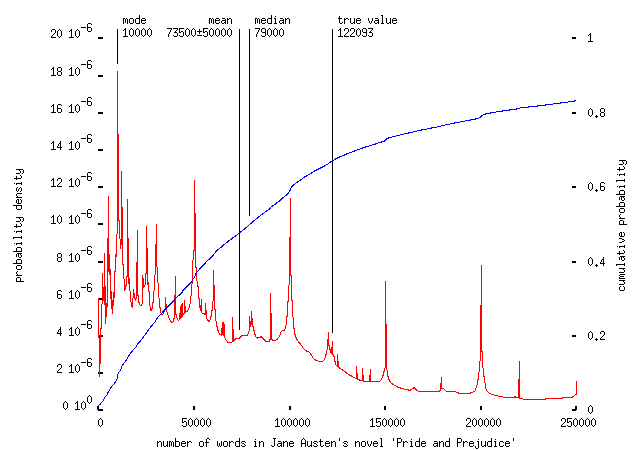
with about two-thirds underestimating the length of the novel and many believing that it's only ten thousand words long. The shape of these we-haven't-a-clue distributions seems to be pretty characteristic; in another example, asked to estimate the maximum take-off weight of a 747-400 airliner, we get the following:
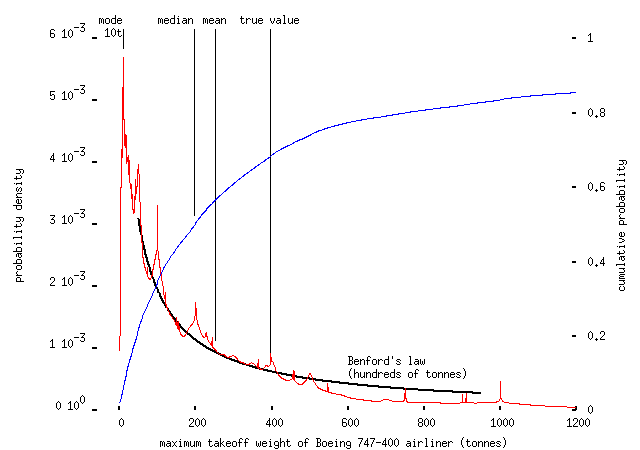
Now, I suspect that some of the people who estimated ten tonnes (the weight of enough fuel for an hour's flight, in the ~230-tonne 'plane) thought the question was asking for the weight of the passengers -- this is one of several cases, like the plastic bag one -- where I didn't word the questions as clearly as I should have; but even the people who got the order of magnitude about right don't seem to have a very good idea of what they're grasping for. I've plotted the curve for Benford's law (which gives the frequency of leading digits of numbers drawn from a scale-invariant distribution) for 100, 200, 300, ... tonnes but I'm not sure this really applies here.
Straight estimation questions -- many of the above can be answered by trying to plug in plausible numbers, but they are quantities which you could reasonably know -- show the same pattern. Asked to estimate the number of petrol stations in the UK (about 12,000) gave this:
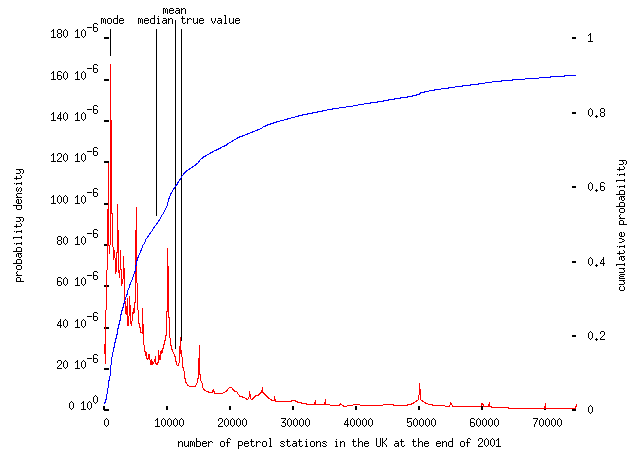
-- the mode is 1,000 (a quantity which would leave each station to be shared by 58,000 people). An even easier question -- how many plastic shopping bags are used every year in Australia (~20 million Australians buying something like one item in a carrier bag every day gives about 7 billion bags per year) -- left respondents completely adrift:
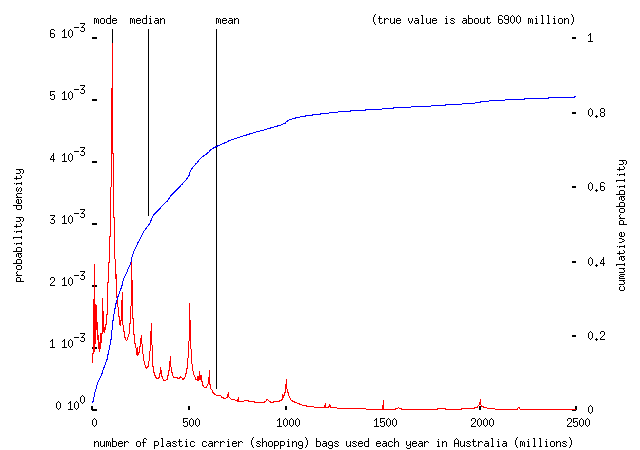
-- the mean is out by about a factor of ten here.
So, that concludes today's foray through slightly eccentric statistics. I'll leave the last few bits and a summary for tomorrow (hopefully), including some comments on the scoring of the quiz, which many people (quite rightly) thought was rather silly.